Search for species - map instructions
How do I map the distribution of a species I am interested in?
To locate the map, go to www.marinebiosecurity.org.nz and click on Maps & Data, then Search for species:
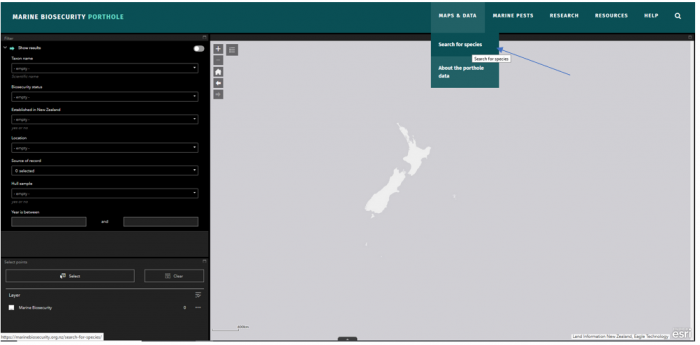
Or on smaller screened devices

The page is dynamic and changes depending on screen size but should look similar to this:
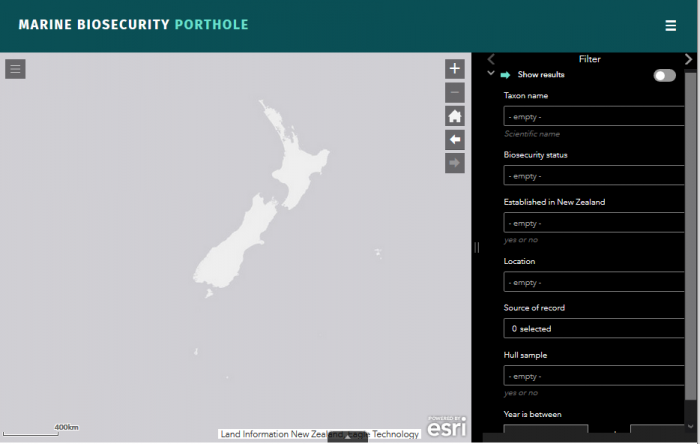
Map filter options
On the Search for species page, the search panel appears on the left hand side of the map but can change depending on the type of device used. This search works like a filter, you can define the filter options in any order to narrow down the search field.
- The Taxon name drop-down box will self-populate with records as you start typing and requires an up to date scientific name (at this stage common names are not able to be searched). The search initially only searches through the first few hundred records, if the name you are looking for doesn’t appear, click on Search more to expand the search. Complete typing the name or click on the name to select the species you are interested in from the list.
- The next option is the Biosecurity Status of the species you are looking for (Non-indigenous, native, Cryptogenic 1, Cryptogenic 2, Indeterminate taxa). For status descriptions click here.
- Filtering records of species known to be established in New Zealand or not (Established in New Zealand). You can also filter by New Zealand locations (Location) that you want to search in and restrict the search to specific sources of data by selecting the databases that are required (Source of record). The default search will simply recover all available records from all record sources. The option to select whether a sample was collected from a vessel hull is available (Hull sample), as well as limiting the search to the years the samples were recorded (Year is between).
- Once you have defined your filter settings, a small toggle at the top of the search panel turns the filter on and off. If switched on with no filter options selected, all database records are displayed and there may be issues with screen loading time.

Troubleshooting the filter
If the species you are searching for is not available from the drop down box, check that you have the correct spelling and current scientific name. Our names are consistent with those found in the World Register of Marine Species. Although many native species are included on this website it is possible that there will not be much data on their distribution as the main focus of the Marine Biosecurity Portal is marine species that are not native to New Zealand.

How do I zoom in and out on a location?
There are several ways to zoom in or out on the map page:
|
1. Use your mouse wheel |
If your mouse has a wheel you can use it to zoom in and out. One wheel click down zooms out one level, one click up zooms up one level. The zoomed map will be centred on the point indicated by the mouse cursor. |
|
2. Use the zoom icons |
The +/– in the top left of the map allows you to zoom using a single click, retaining the current centre of the map. Click the "+" on top of the to zoom in one level Click the "-" on the bottom to zoom out one level. |
|
3. Extent views |
Use the Forward or backward arrows to move through the different zoomed views used in your current session. |
|
4. Shift/Click/Zoom |
Press the Shift key and hold the left mouse button down to draw a rectangle around the area you want to zoom to. Release the mouse button to zoom to the specified area. |
How do I scroll or pan across the map?
|
1. Click & drag |
Click and hold the left mouse button and drag the map to where you want. It will redraw in the new location. |
Clicking on the Home icon will re-adjust the map extent so that the entire country is in view and all points are hidden.
What is shown on the map?
The map will display individual circles in the locations that the species were recorded. They are colour coded according to the source of record and the legend symbol on the screen will display the source of record legend.

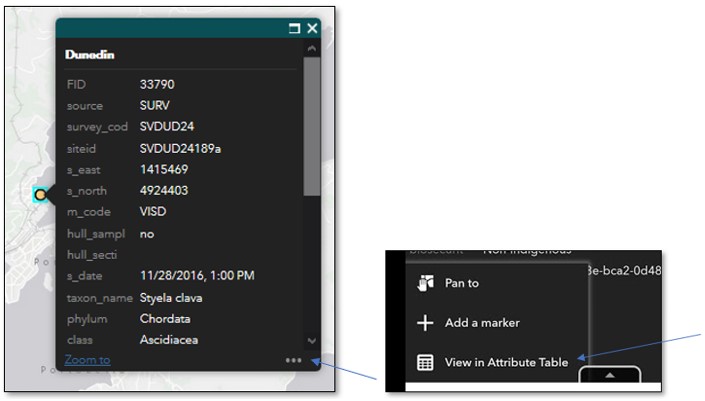
To access more information about a record, click on an individual circle on the map and depending on the device you are using to search, either a metadata box or short banner description will appear. When using smaller screened devices click the arrow in the description banner to open up a larger metadata box.
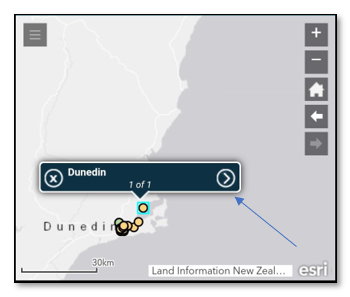
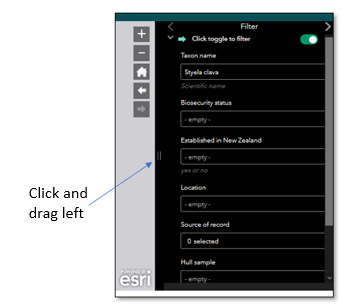
Depending on the size of your screen, viewing the metadata may require extending the size of the side panel by sliding it across to the left.
Once the metadata box is open, in the popup click on the 3 dot symbol at the bottom (see image below), the option to view more information about the record in the attribute table is available. If viewing the metadata using the side panel you have to use the Select function detailed in the next section.
What data can I view and download?
Data can be viewed and exported for all species and search criteria but is capped at a maximum download of 1000 records.
The option to select specific points for download or further examination after filtering is also available. On the filter panel on smaller screened devices click the arrow to change the filter option or on larger screens it will already be loaded underneath the main filter.

The Marine Biosecurity layer checkbox will need to be selected to turn the select points filter option on. Click Select and when hovering the mouse over the button, instructions on how to use the selection features will appear, either on the map or next to the mouse icon.

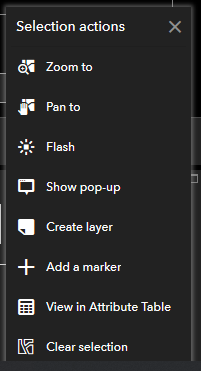
Once selected features are highlighted, the number of selected points will appear next to the layer name in the selection panel. By clicking on the 3 dot symbol next to the number of features selected you are given the option to zoom to the selected features, pan to, flash, show pop up, create layer, add a marker, view in attribute table or clear the selection. If the view in attribute table is option is selected, this subset of selected records can then be downloaded from the attribute table.

The create layer option, creates a whole new layer that is available in the selection panel for filtering, downloading and viewing in the same manner as the main Marine Biosecurity layer. These new layers can be made on multiple subsets of data but are only available within your current viewing session. Once the browser is closed these layers will be deleted.
The attribute table, which can be maximised by clicking the small black box at the bottom centre of the map, has an option to ‘export all to csv’ under the Options tab at the top left of the table.

The download will be available in your web browser download folder called ‘Marine Biosecurity.csv’.
Note: For Internet Explorer 8 and 9, you need to manually enter the .csv extension when you save the exported file. For Safari, you need to manually rename the exported file that is saved as Unknown by default.
The Options tab of the Marine biosecurity attributes table also gives users the ability to create their own specific filters based on all the columns that are available in the attribute table, not just those that are immediately available in the main search filter on the mapping page. Filters can be made using expressions. These expressions use the general form of <Field_name> <Operator> <Value, Field or Unique>. You can also create a set or group of expressions.
What do the different Biosecurity Status's mean?
|
Non-indigenous |
Species that are not native to New Zealand biogeographic region, but which are known or suspected to have been introduced as a result of human activities. |
|
Native |
Species that occurred within the New Zealand biogeographic region historically and have not been introduced to coastal waters by human activities. |
|
Cryptogenic 1 |
Species previously recorded from New Zealand whose identity as either native or non-indigenous is ambiguous. This uncertainty may be because the species was spread globally in the era of sailing vessels, prior to scientific investigation so that it is no longer possible to determine their original native distribution. Also included in this category are recently described species that exhibited invasive behaviour in New Zealand, but for which there are no known records outside the New Zealand region. |
|
Cryptogenic 2 |
Species that have recently been discovered, but for which there is insufficient systematic or biogeographic information to determine whether New Zealand lies within their native range. This category includes previously undescribed species that are new to New Zealand and/or science. |
|
Indeterminate taxa |
Specimens that could not be identified to species reliably. This group includes:
|
Where can I read more about the surveillance programmes and data?
Reports associated with the programmes are contained in a Geonetwork metadata catalogue (see the Publications page). The catalogue allows you to access a list of relevant reports. Items in the list can be clicked on to provide more detailed information about each one and can be downloaded directly as PDFs if they are available. Each project's menu allows you to access the Publications page. You can retrieve the reports in two ways:
|
1. Browse the catalogue |
The Browse button in the Publications page retrieves a list of all reports in the catalogue and provides a sorted list of titles. You can click on the title to see more detail about the report and optionally download a copy of the report if you wish. |
|
2. Searching reports |
The Search facility on the Publications page allows you to enter keywords to retrieve a list of reports that match the keyword criteria. As in the report browser, you can click on the title to see more detail about a report and download a copy. |